
Summary, Dashboards, and Responses
Results Studio organizes analysis into three tabs: Summary, Dashboards, and Responses. Start on Summary for health checks, move to Dashboards for question-level charts, then use Responses for row-level detail.
Summary
Section titled “Summary”Summary answers “how is the study performing?” at a glance.
Survey and usability test metrics
Section titled “Survey and usability test metrics”| Metric | Meaning |
|---|---|
| Visited | Participants who opened the study |
| Answered | Participants who submitted at least one answer |
| Completed | Participants who finished, with average duration |
| Completion rate | Completed relative to relevant starts |
In-product survey metrics
Section titled “In-product survey metrics”| Metric | Meaning |
|---|---|
| Impressions | Times the survey was shown |
| Responses | Participants who answered |
| Completed | Finished sessions |
| Response rate | Responses relative to impressions |
Summary also includes a Response progression chart over time and an AI Insights panel on eligible plans. Use Filter insight focus (All highlights, By question, By task, By user segment) and Regenerate insights when you need a fresh pass. Details: AI summaries.
Dashboards
Section titled “Dashboards”Dashboards is the chart overview for the study.
- Open the Dashboards tab.
- Review the default dashboard (one insight area per question or task).
- Optionally turn on Cross-filter, click chart elements to narrow the view, then Clear all when done.
- Change a chart’s Chart type where alternatives exist.
- Use New dashboard, Edit, Share, or Download All for stakeholder views.
Custom and Smart AI dashboards are covered in Custom dashboards. Chart choices by question type are listed in Charts by question type.
Responses
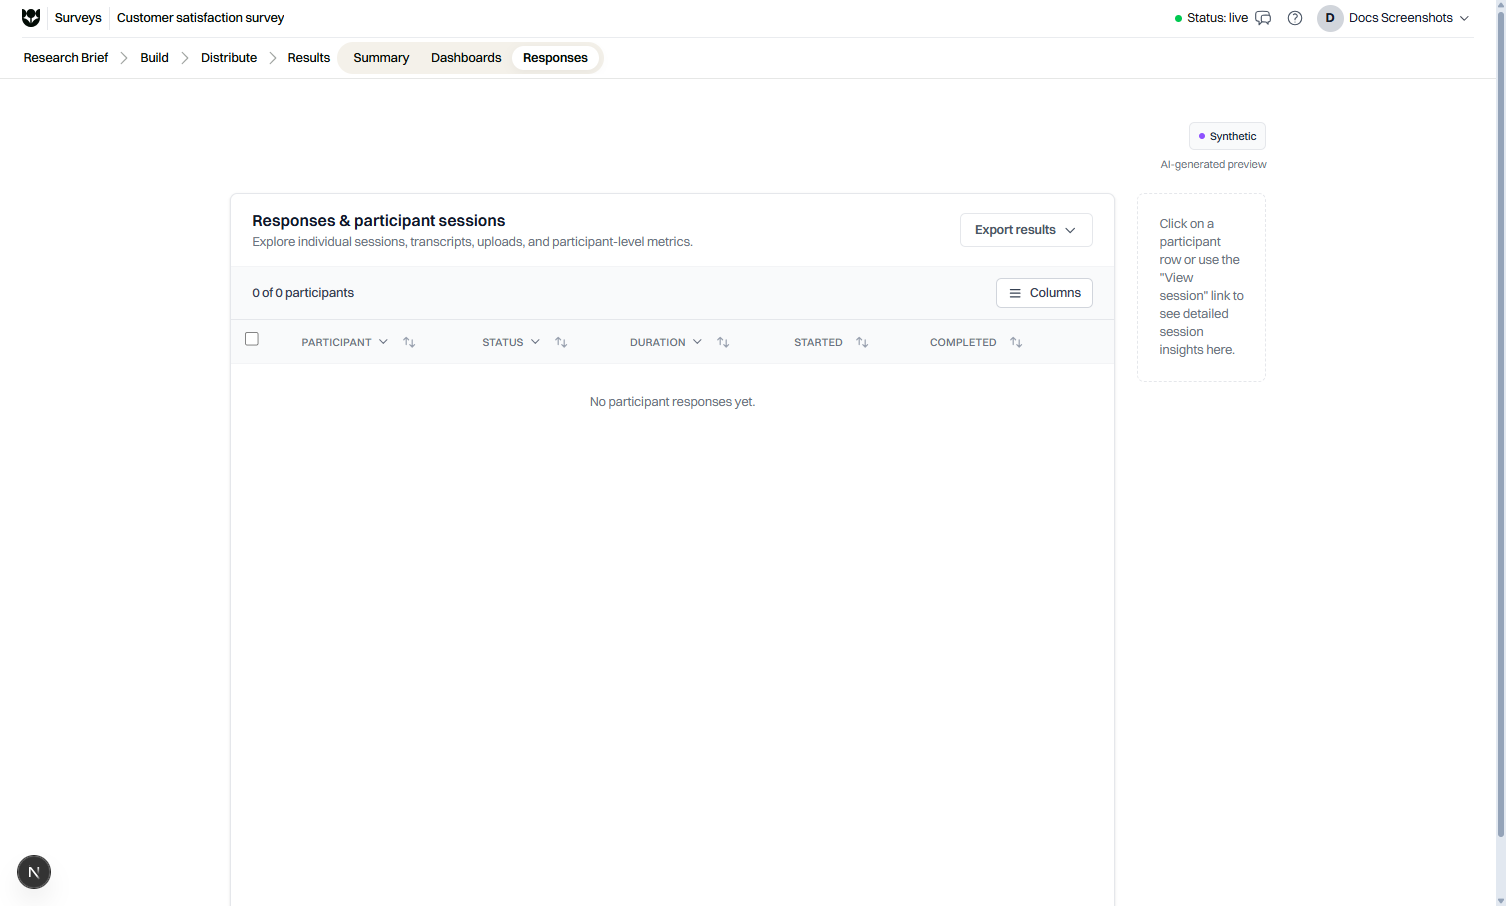
Section titled “Responses”The Responses tab is labeled Responses & participant sessions. Use it when you need the raw table and individual sessions.
Table tools
Section titled “Table tools”- Column filters and sorting
- Column selector to show or hide fields
- Delete selected for bulk removal (when permitted)
- Row actions: View session, and View recording when a recording exists
Session details
Section titled “Session details”Opening a session typically shows:
| Field | Notes |
|---|---|
| Status | Session outcome |
| Duration | Time spent |
| Started at / Completed at | Timestamps |
| Compare exposure | Assigned group and page / group / asset mapping when compare is used |
| Answers | Per-question responses |
For video and audio answers, use Show Transcript / Hide Transcript when transcription is available.
Example
Section titled “Example”After launching a product survey:
- Confirm Completed and completion rate on Summary.
- On Dashboards, switch the NPS chart to Breakdown, then cross-filter promoters vs detractors on an open-text question.
- On Responses, open three sessions from each segment and export Current view if you need that cohort in Excel.
Limitations
Section titled “Limitations”- Summary metrics do not replace question-level significance testing.
- Cross-filter state is for exploration in the UI; export Current view if you need the filtered table.
- Recording and some AI panels require Pro (or Custom), unless your organization uses an allowed bring-your-own key for specific AI tools.
Related
Section titled “Related”Common questions
What is the difference between Summary and Dashboards?
Summary shows study-level metrics and AI Insights. Dashboards show charts for each question and any custom dashboards you create.
Can I delete responses from the Responses tab?
Yes, if your role allows it. Select rows and use Delete selected. Deletion cannot be undone from the UI.
Where do I open a recording?
On the Responses tab, use View recording when a session has a recording. You can also open session details from View session.