
Results Studio
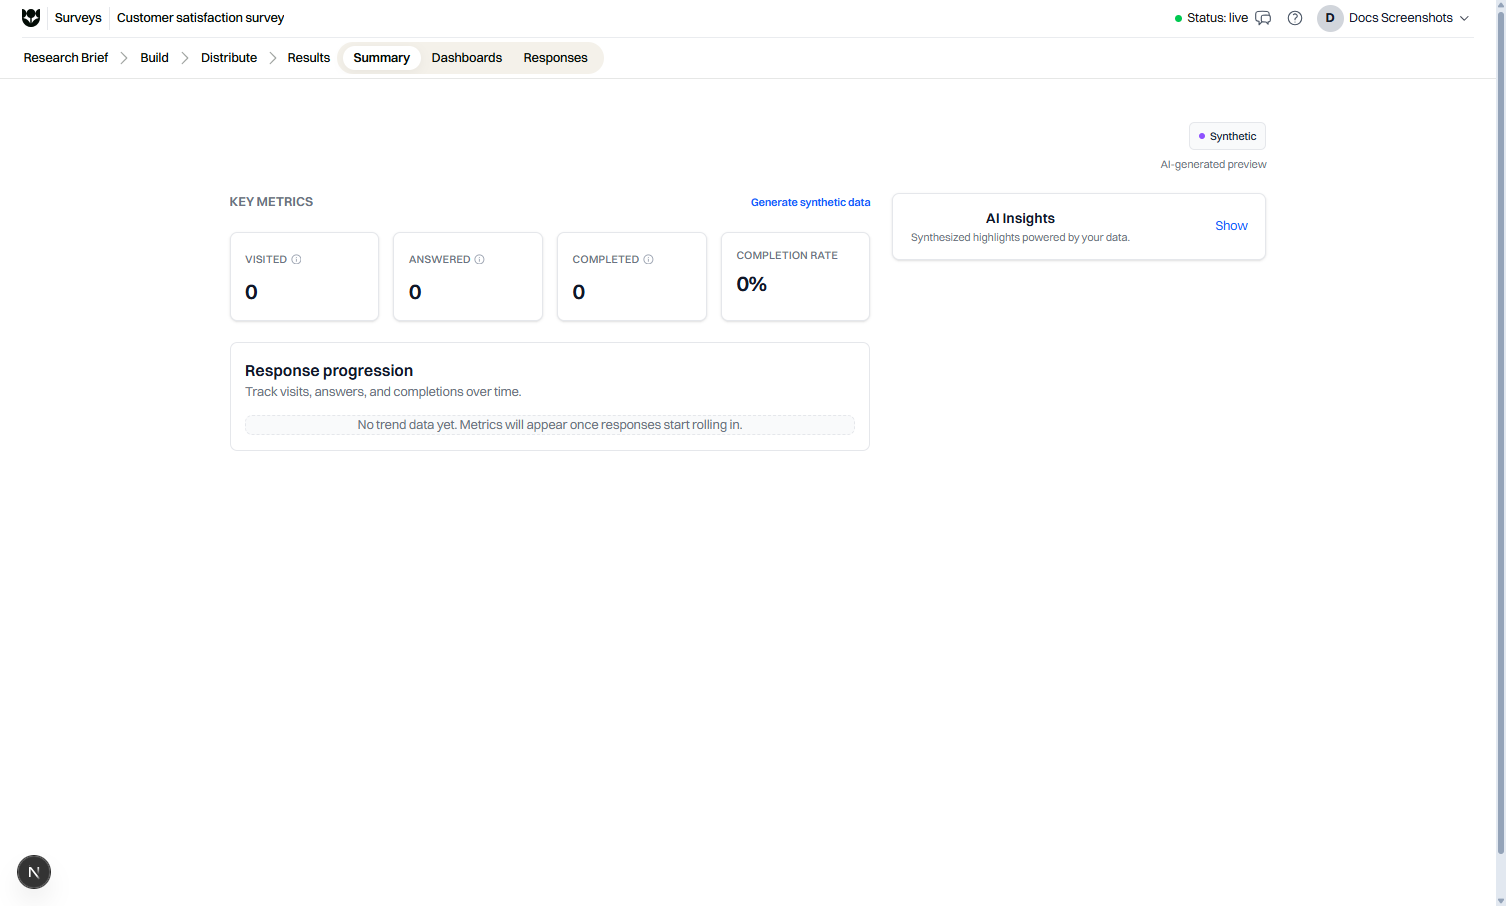
Results Studio is where you analyze completed and in-progress responses for a study. Open it from any survey, usability test, or in-product survey that has collected data (or synthetic demo data).
When to use it
Section titled “When to use it”- Check completion and response volume after a launch.
- Explore charts by question, filter cohorts, and compare experiment arms.
- Review usability evidence (task outcomes, click heatmaps, path analysis, recordings).
- Build stakeholder dashboards and export Excel or chart packages.
How to open Results Studio
Section titled “How to open Results Studio”- Find the study in Surveys, Usability Tests, or In-Product Surveys.
- Open the study row menu or actions and choose Results.
- Or open the study editor and switch to the Results category.
Results always open in the context of that study. Use filters, compare-group selectors, and the Real / Synthetic toggle (when both exist) before you draw conclusions.
What you see
Section titled “What you see”| Area | Purpose |
|---|---|
| Summary | High-level volume metrics, progression, and AI Insights |
| Dashboards | Default per-question charts plus custom and Smart AI dashboards |
| Responses | Participant sessions table, session details, transcripts, recordings |
Usability tests surface extra charts and session tools when tasks and recording are configured. In-product surveys emphasize impressions and response rate alongside answers.
Shared analysis tools
Section titled “Shared analysis tools”Across tabs you can typically:
- Filter and cross-filter charts where supported.
- Switch Compare group when the study uses randomization or compare assets.
- Toggle Real vs Synthetic data when demo responses were generated.
- Export responses or download charts (see Export).
Pro features such as AI Insights, Ask Data, custom dashboards, and screen recording appear when your plan (or bring-your-own AI key, where allowed) unlocks them.
Example workflow
Section titled “Example workflow”- Open Results after the first day of fieldwork.
- On Summary, confirm Visited, Answered, Completed, and completion rate look healthy.
- On Dashboards, scan key questions and enable Cross-filter to drill into a segment.
- On Responses, open a few View session rows (and recordings when available).
- Create a custom dashboard for stakeholders, then share or export.
Limitations
Section titled “Limitations”- Analysis is per study. Cross-study portfolios are not a single Results Studio view.
- Preview traffic and Live responses should be interpreted carefully if you mixed both.
- Some advanced widgets and recording tools require Pro (or Custom).
Related
Section titled “Related”Common questions
How do I open Results Studio for a study?
From the study list, choose Results on the study row. Inside the editor you can also open the Results category.
Do surveys and usability tests share the same results experience?
Yes. All study types use Results Studio. Usability tests add task metrics, heatmaps, path analysis, and recordings when those features are enabled.
Can Viewers open results?
Viewers can open studies and results they have access to. Export and download options may be limited by role and plan.